
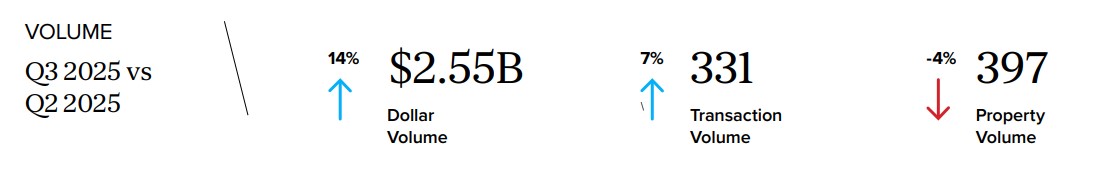
New York City Multifamily Volume Totaled $2.55 Billion in Q3 2025, Up 14% From Q2 2025, GREA Report Shows
New York City’s multifamily market gained momentum in the third quarter, rising to $2.55 billion in sales, up 14% quarter-over-quarter and 17% year-over-year, according to GREA Q3 2025 Multifamily Quarter in Review New York City. Transactions totaled 331, up 7% from Q2 2025 and up 23% from Q3 2024.
Nearly half of the dollar volume in the third quarter was in Manhattan where sales were dominated by well-capitalized investors targeting high-value free-market multifamily assets. The quarter’s two largest trades included GO Residential Real Estate Investment Trust’s acquisition of an approximately 30% stake in a three-building Upper East Side luxury multifamily portfolio for $352.2 million, and JP Morgan’s acquisition of a 44-story, 422-unit luxury apartment building at 560 West 43rd Street for $243.5 million.
“Investors continue to favor free-market multifamily buildings, which made up 84% of New York City’s dollar volume in Q3,” said Shimon Shkury, President and Founder of GREA’s New York office. “Regulatory flexibility, rent growth and steady demand keep driving that strength, while rent-stabilized assets remain challenged since HSTPA.”
The New York City mayoral election was at the top of the report’s Watch List, noting that Democratic primary winner and current frontrunner Zohran Mamdani has built his campaign around a pledge to implement a rent freeze on all rent-stabilized apartments citywide. This has sparked significant concern among investors and landlords who are calculating how 0% rent growth could affect valuations, underwriting and investment strategies.
Manhattan.
Manhattan led all the boroughs in multifamily investment sales in Q3 2025, posting $1.26 billion in total dollar volume, of which 94% was for free market buildings. Dollar volume was up 256% from Q2 2025 and 14% year-over-year, while transaction activity also climbed to 54 sales, a 42% increase from the prior quarter and 15% higher than Q3 2024. This resurgence in both sales activity and investor sentiment has begun to push pricing upward for fully free-market properties in Manhattan, which averaged $859/SF year-to-date in 2025, a 7.8% increase compared to full year 2023 levels.
Brooklyn.
Brooklyn followed Manhattan with $874.1 million in dollar volume, a 19% decline quarter-over-quarter but 54% increase year-over-year, while transactions rose to 169, up 17% and 35%, respectively. Like Manhattan, free market buildings were the most popular investments, accounting for 90% of the dollar volume for the quarter. A notable transaction was the sale of a 107,986-square-foot building at 146 South 4th Street for $82.5 million.
Northern Manhattan.
Of the dollar volume, 64% was for free market assets, while 33% was rent stabilized and 3% affordable. A notable transaction was the $62 million sale of 601-611 West 137th Street, a 225,541-square-foot multifamily. Dollar volume totaled $146.13 million, up 195% from Q2 2025 but down 32% from Q3 2024. Transactions totaled 16.
Queens.
In Queens, dollar volume fell 55% to $139.58 million in Q3 2025 from Q2 2025 and declined by 9% from Q3 2024. Transactions also declined quarter-over-quarter by 22% to 64. Rent stabilized buildings accounted for 61% of the dollar volume and 56% of the transactions. A featured sale was a 108,499-square-foot building at 35-28/35-30 153rd Street, which traded for $11.5 million.
The Bronx.
Notably, 63% of the Bronx’s total dollar volume and 86% of the transactions came from rent-stabilized properties. The largest rent-stabilized transaction occurred in the Longwood section of the Bronx. The Tegford Portfolio, a 249-unit package, sold for $19,625,000 million ($79,000 per unit), with GREA brokering the transaction on behalf of Arthur Leeds Management. Dollar volume totaled $133.36 million in Q3 2025, a decline of 70% from the second quarter but relatively flat year-over-year, across 28 transactions.
For more information and to read the full report, please click below.