

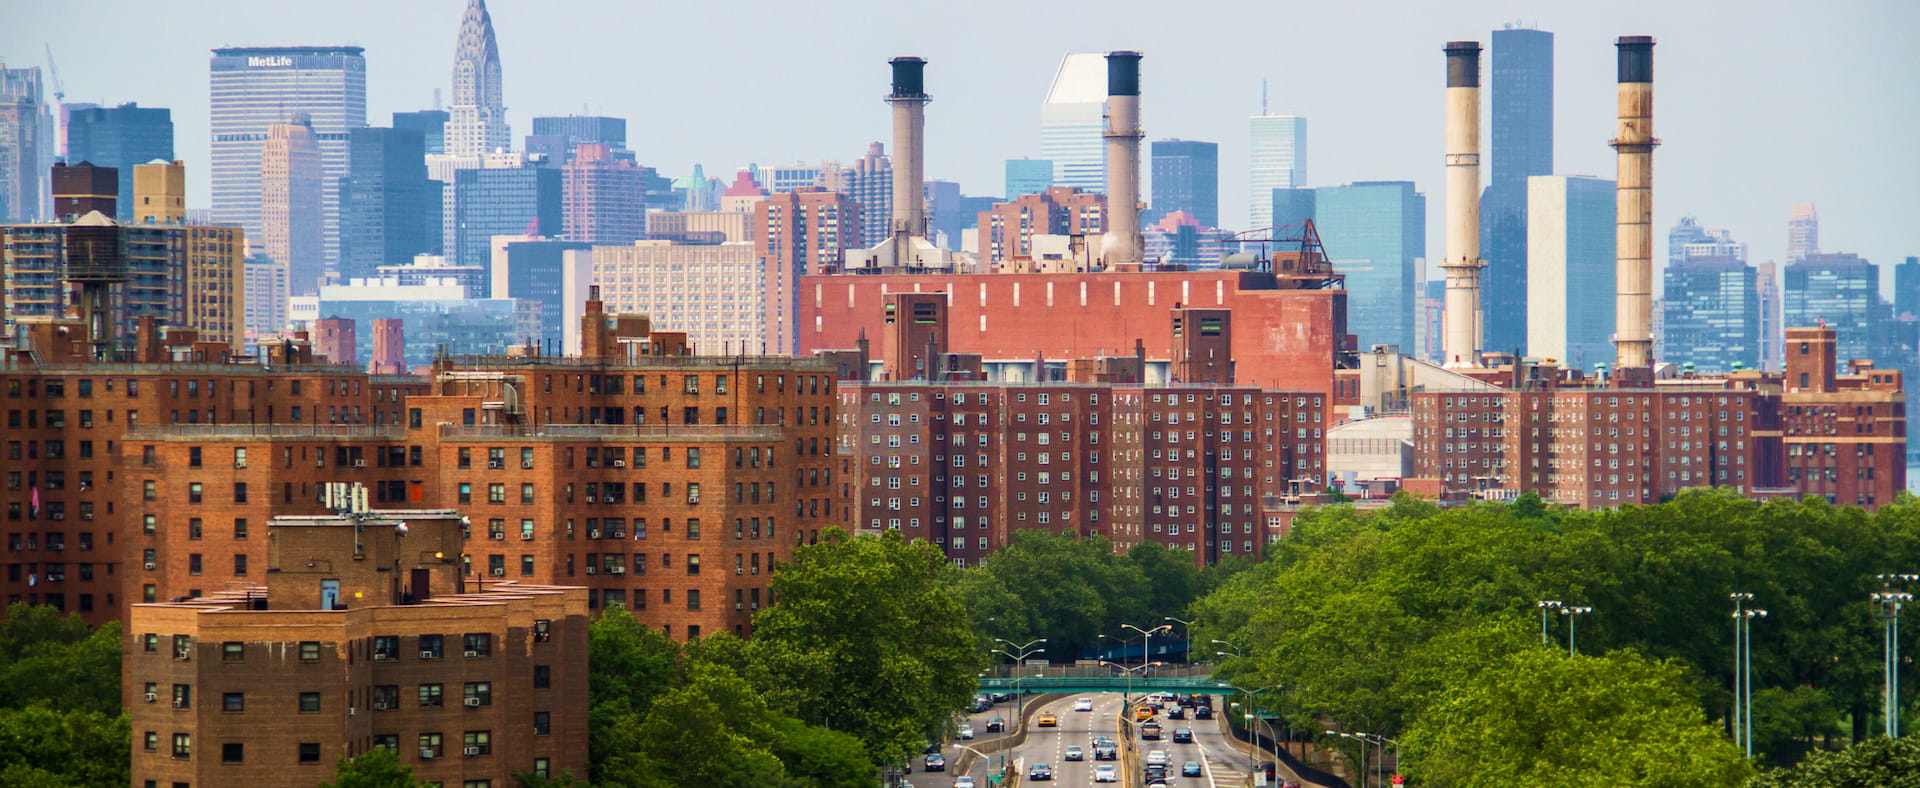
New York City’s multifamily sales totaled $2.46 billion across 298 transactions in Q2 2026, a 25% increase in dollar volume but 4% decline in transaction volume compared to Q2 2025, according to GREA’s Q2 2026 Multifamily Quarter in Review.

“What we are seeing in the first half of 2026 is a tale of two very different markets, both presenting unique opportunities,” said Shimon Shkury, President and Founder of GREA. “On one side, Manhattan’s free-market sector is showing exceptional strength, rents are up 10% year-over-year, and high-conviction buyers are writing significantly larger checks for supply-constrained assets. On the other side, rent-stabilized assets are undergoing a massive, painful valuation reset amidst rising expenses and refinancings at double their original rate. Longtime rent stabilized owners are exiting, and a new wave of buyers is stepping in to acquire these properties at steep discounts. Meanwhile, affordable housing remains a resilient safe haven, drawing deep institutional demand due to its stable, government-backed income.”
Submarket Highlights
Manhattan (Below 96th Street)
- Manhattan’s multifamily dollar volume rose 315% to $1.47 billion in Q2 2026 compared to Q2 2025, and transactions increased 21% to 46 over this period.
- Free market buildings accounted for 72% of Manhattan’s dollar volume and 67% of the transactions, trading at an average of $732,709/unit in Q2 2026 and $892/SF, up slightly from last year’s $886 but 14% below the 2017 peak.
- In a noteworthy free market trade, Carmel Partners acquired MetLife’s 49% interest in a five-building, 710-unit Upper West Side rental portfolio along Columbus and Amsterdam Avenues for $241.3 million, a price made possible by stepping into in-place Fannie Mae financing at a 2.6% rate through 2031.
Brooklyn
- Second quarter multifamily volume in Brooklyn totaled $561.64 million across 132 transactions, declines of 33% and 10%, respectively, compared to Q2 2025.
- Free-market buildings led the borough’s market share with 64% of the dollar volume and 53% of transactions and pricing for these assets averaged $510/SF and $510,653 per unit. In contrast, buildings with 75+ rent stabilized units accounted for 27% of the dollar volume and 27% of the transaction volume, trading at an average of $167/SF and $146,000/unit.
- A significant rent stabilized transaction was the LeFrak Organization’s Brooklyn Multifamily Portfolio, a 75%+ rent stabilized asset spanning 328,200/SF that traded for $34 million.
The Bronx
- Bronx multifamily dollar volume fell 54% year-over-year to $204.74 million in Q2 2026, across 42 transactions, up 27% from Q2 2025.
- Rent-stabilized properties, which accounted for 45% of the Bronx’s total dollar volume and 76% of the transactions, continued to see a drop in value to an average of $76/SF and $68,842/unit, which is 59% below pre-HSTPA values.
- Examples of rent stabilized pricing in the Bronx included the sale of 66–72 East 190th Street, two adjacent buildings with 40 units purchased for $4.7 million in 2021 that went through foreclosure at $2.35 million ($59,000/unit), and a single legacy owner that liquidated nine Bronx buildings totaling 580 units across seven trades for $37.3 million (roughly $64,000/unit).
Queens
- Multifamily dollar volume in Queens dropped 53% to $135.86 million in Q2 2026 compared to Q1 2025. Transactions fell 16% year-over-year to 68.
- Buildings with 75 or more rent-stabilized units represented 76% of the dollar volume and 67% of the transactions, trading at $202/SF and $224,845/unit.
- Featured transactions included a 75+ rent stabilized asset totaling 23,064 SF at 45-07 43rd Avenue & 41-49 45th Street, which sold for $5 million, while a 16,125 SF free market asset at 86-26 85th Street and 84-39/84-45 Jamaica Avenue traded for $4.55 million.
Northern Manhattan
- Northern Manhattan dollar volume totaled $90.56 million in the second quarter, up 83% from Q2 2025, and transactions fell from 14 to 10 year-over-year.
- Buildings with 75%+ rent stabilized units accounted for 28% of the dollar volume and 50% of the transactions, with these sales averaging $159/SF and $120,684/unit. The submarket also saw 61% of the dollar volume and 25% of the transactions in affordable buildings with regulatory agreements.
- A standout affordable housing transaction was the Hudson View II and III Portfolio In Hamilton Heights, four buildings with 129 Project-Based Section 8 units and 11 commercial units that sold for a combined $45 million ($315 per square foot). GREA arranged the sale.
The full Q2 2026 Multifamily Quarter in Review New York report is available here.