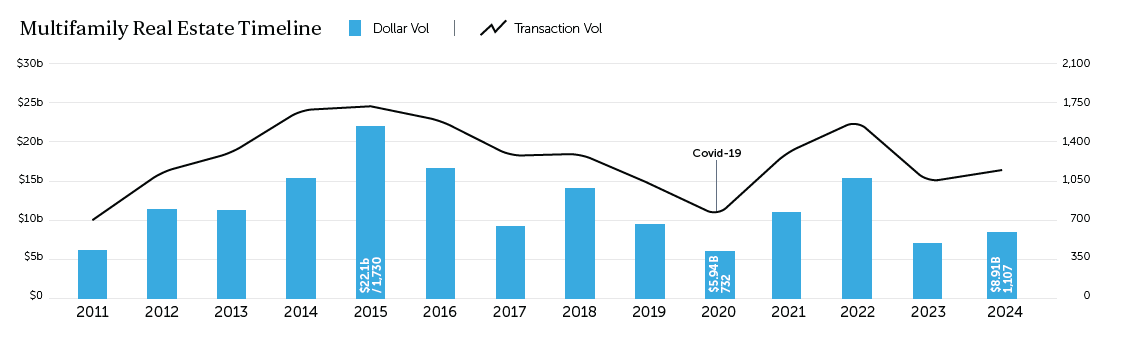
NEW YORK, NY – January 23, 2025 – New York City’s multifamily market recorded $8.9 billion in dollar volume in 2024, a 14% increase from 2023, according to the Multifamily Year in Review New York City 2024, produced by Ariel Property Advisors, a member of GREA. Transactions rose 4% year-over-year to 1,107.

Citywide, predominantly free market buildings accounted for 63% of the multifamily dollar volume and 48% of the transaction volume in 2024, followed by predominantly rent stabilized assets, which accounted for 29% of the dollar volume and 47% of the transactions. The remaining sales were for buildings with regulatory agreements.
“Although values for free market multifamily buildings across New York City have declined from their 2015 peak, pricing for these assets increased slightly in 2024 compared to 2023,” said Shimon Shkury, President and Founder of Ariel Property Advisors. “Values for rent stabilized buildings, however, have dropped 35-60% below their 2017-2018 peak as owners continue to struggle under the weight of rising expenses combined with the 2019 Housing Stability and Tenant Protection Act (HSTPA), which capped rents.”
Multifamily Market Trends
- Free Market. Attractive pricing was a key driver in free market sales in 2024, particularly in Manhattan. For example, Canvas Investment Partners acquired 210-220 E 22nd Street for $104.5 million, 15% below its 2015 sale price of $123 million. Other factors included strong fundamentals–Manhattan rents have risen over 20% in the past three years and nearly 4% in the last year alone–mortgage maturities and prime locations.
- Rent Stabilized. Investors in rent stabilized buildings continued to be primarily family offices and private individuals drawn by the drop in valuations and belief that the current regulations are unsustainable. With long-term strategies in mind, these buyers often acquire properties using all cash or minimal leverage, banking on potential regulatory changes in the future.
- Affordable Housing. Key transaction drivers for affordable housing included in-place assumable financing and potential collaboration between the city and state to preserve affordable housing. This could involve providing subsidies, extending benefits, and incorporating Section 610 of the Private Housing Finance Law into regulatory agreements.
Apart from the Bronx, all submarkets across New York City posted year-over-year increases in multifamily dollar and building volume and number of units sold. Submarket highlights include:
- Brooklyn. This submarket saw the highest level of multifamily dollar volume in New York City in 2024, with sales valued at $3.48 billion, a 59% year-over-year increase. Transactions totaled 517, a slight 1% increase from 2023. Predominantly free market buildings accounted for 76% of the dollar volume, while rent stabilized accounted for only 20%. Significant transactions included the sale of 540 Fulton Street for $235.4 million and 80 DeKalb, which traded for $202.5 million.
- Manhattan below 96th Street. Manhattan’s multifamily dollar volume rose 11% year-over-year to $3.44 billion in 2024. Transactions totaled 182, a slight 2% increase from 2023. As in Brooklyn, free market trades in Manhattan comprised 76% of the total dollar volume and rent stabilized dollar volume accounted for 20% of the total. Significant sales included 20 Exchange Place, a 786,942-square-foot building with 768 units, which traded for $370 million, and 200 West 67th Street, which sold for $265 million.
- Queens. The Queens submarket saw dollar volume rise 13% year-over-year to $851.4 million. Transactions also increased by 10% to 249. In contrast to Brooklyn and Manhattan, rent stabilized building sales dominated, accounting for 72% of the dollar volume and 77% of the transaction volume, followed by buildings with regulatory agreements at 15% and 2% and free market trades at 13% and 21%, respectively. Featured transactions included the Lefrak Flushing MF Portfolio, comprised of four properties with 506 units totaling 517,853 square feet, which sold for $71.5 million, and 34-34 77th Street, 40-40 79th Street and 56-11 94th Street, which traded for $46.5 million.
- Northern Manhattan. Northern Manhattan saw a 7% year-over-year increase in dollar volume to $674.5 million, and an 11% increase in transaction volume to 69 trades. While rent stabilized buildings accounted for 51% of the dollar volume and 59% of the transaction volume, buildings with regulatory agreements also had a strong showing, accounting for 35% of the dollar volume and 16% of the transaction volume. Significant trades included 107-145 West 135th Street, which sold for $64 million, and the Sentinel Hamilton & Washington Heights MF Portfolio, which traded for $55.8 million.
- The Bronx. This submarket trailed the rest of the city in 2024 and recorded the only year-over-year decline in dollar volume, which fell 59% to $457.9 million. Transactions, however, rose 10% to 91. The borough sold a mix of multifamily types last year—free market accounted for 30% of the dollar volume and 27% of the transactions; rent stabilized 53% of the dollar volume and 67% of the transactions; and buildings with regulatory agreements 17% of the dollar volume and 6% of the transactions. Significant trades included 250 East 144th Street for $45.75 million and 1039 East Gun Hill Road for $27.018 million.
The Multifamily Year in Review New York City report is available here.