


Shimon Shkury
President & Founder
Ariel Property Advisors
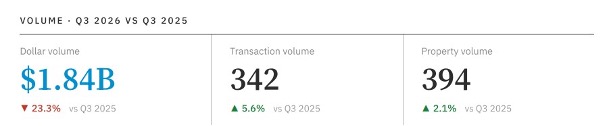
NEW YORK, NY – October 16, 2026 – New York City’s multifamily sales totaled $6.99 billion across 1,044 transactions in the first three quarters of 2026, increases of 7.9% and 11.5%, respectively, according to Ariel Property Advisors’ Q3 2026 Multifamily Quarter in Review.
“Last quarter we continued to see a clear divergence in performance across multifamily property types,” said Shimon Shkury, President and Founder of Ariel Property Advisors. “Free-market properties and subsidized affordable housing with predictable cash flows continue to attract strong investor interest, while rent-stabilized assets face significant valuation pressure from regulatory constraints and financing challenges.”
Submarket Highlights
Brooklyn
- Brooklyn edged past Manhattan as the quarter’s most active multifamily submarket in the third quarter with $693.8 million in total dollar volume, down 12.8% compared to Q3 2025. However, transaction volume rose 12.7% year over year to 178.
- Free-market buildings dominated the borough’s sales accounting for 86.3% of the dollar volume and 50% of the transactions. Pricing averaged $509,000/unit and $552/SF.
- A featured transaction was the sale of a 53,200-square-foot free market multifamily at 315 Seigel Street in Williamsburg that traded for $30 million.
Manhattan (Below 96th Street)
- Manhattan’s multifamily dollar volume fell to $685.2 million; a 43.6% decline compared to Q3 2025. Third quarter transactions remained steady at 58.
- Buildings with 75% or more free market units accounted for 82.6% of Manhattan’s dollar volume and 53.8% of the transactions, trading at an average of $684,000/unit in Q3 2026 and $844/SF.
- A significant Manhattan trade was the sale of a 190,289-square-foot free market multifamily at 260 West 52nd that sold for $103,850,227.
Northern Manhattan
- Northern Manhattan dollar volume totaled $172.2 million in the third quarter, up 32.8% from Q3 2025, while transactions were steady at 16.
- Buildings with 75%+ rent stabilized units accounted for 41.8% of the dollar volume and 83.3% of the transactions, with these sales averaging $143/SF and $121,000/unit. The submarket also saw 55.9% of the dollar volume and 8% of the transactions in affordable buildings with regulatory agreements.
- A standout affordable housing transaction was a 181,111-square-foot asset at 1920 Amsterdam Avenue that sold for $80 million.
Queens
- Multifamily dollar volume in Queens increased 26.9% to $167.2 million in Q3 2026 compared to Q3 2025. Transaction volume was stable at 62 trades.
- Buildings with 75%+ rent stabilized units represented 49.5% of the dollar volume and 50% of the transactions, trading at $193/SF and $155,000/unit.
- Featured transactions included a predominantly rent stabilized asset totaling 48,780 square feet at 109-01 72nd Street in Forest Hills, which sold for $11.5 million, while a 23,757-square-foot free market asset at 41-34 45th Street in Sunnyside traded for $10.5 million.
The Bronx
- Bronx multifamily dollar volume fell by 5% year-over-year to $123.5 million in Q3 2026, across 28 transactions down from 31 transactions during the same quarter last year.
- Buildings with 75%+ rent-stabilized units accounted for 81.3% of the Bronx’s total dollar volume and 69.2% of the transactions, with values averaging $76/SF and $68,842/unit, unchanged from the previous quarter and 59% below pre-HSTPA values.
- A representative third quarter transaction was the 306-unit predominantly rent stabilized multifamily portfolio in the Fordham section of the Bronx that sold for $15 million.
The full Q3 2026 Multifamily Quarter in Review New York report is available below.
Download